
基于ggdensity包的等高线绘制
创始人
2025-05-29 23:06:07
简介
科研过程中,需要绘制某个后验密度/其他的形状。在发表论文中常常使用等高线来满足该需求。例如:文献中所给出的图:
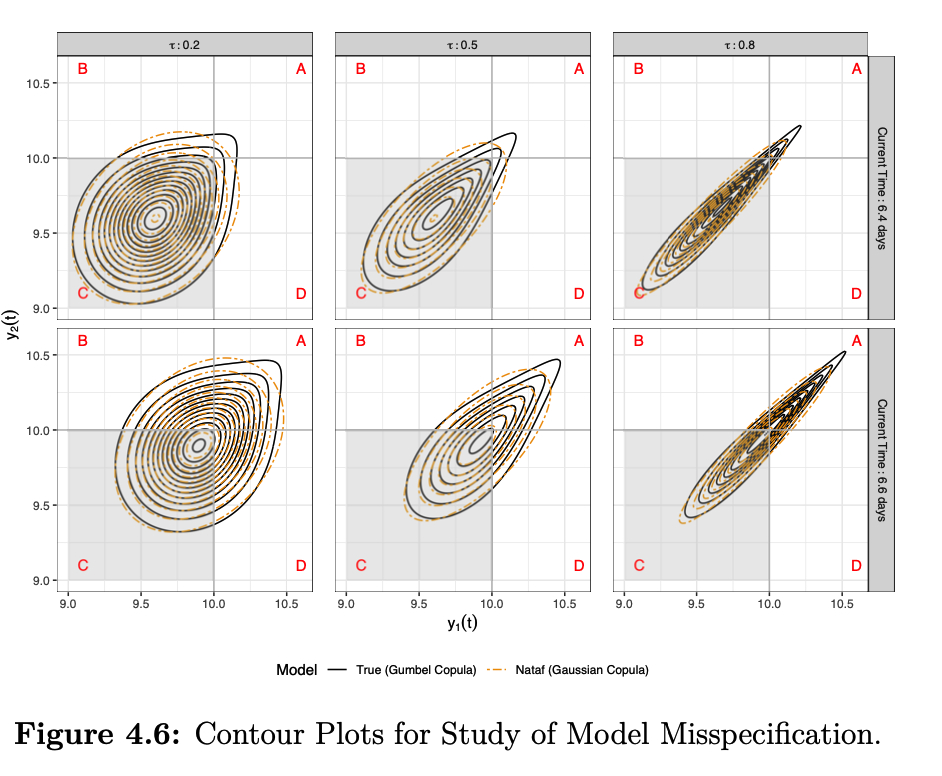
今天小编主要学习下 ggdensity 来绘制不同类型的等高线,以便今后查阅和使用。并在此基础上,简单学习了另一种方式(ggblanket 包)构建等高线。全文使用 [ggsci]((https://nanx.me/ggsci/ )) 来修改配色。
主要参考的资料有1、2。
教程
数据介绍
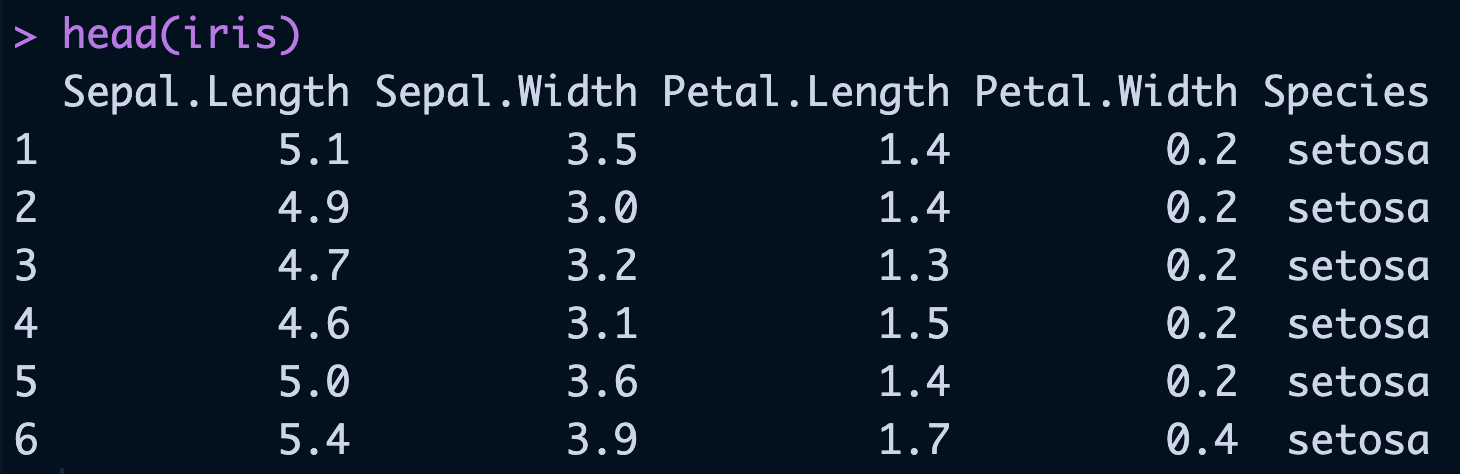
本文使用常用数据集 iris 来作为例子。该数据集的前 6 行数据如下所示:
使用的 R 包包括:
library(ggdensity)
library(ggblanket)
library(ggsci)
版本一
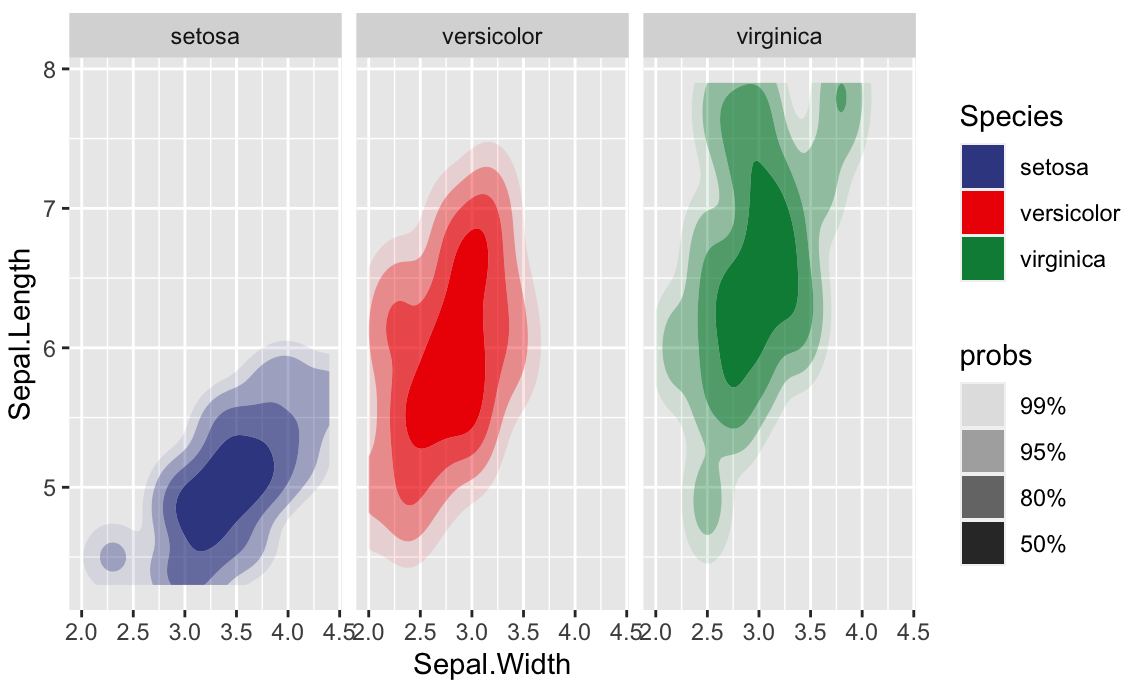
使用 geom_hdr() 绘制等高线,配合 facet_wrap() 分面和 ggsci 包中的 scale_fill_aaas()修改配色方案。这是最简单的版本,其实大体上已经符合我的需求了。接下来展示在此基础上的一些调整,供大家以后参考使用。
ggplot(iris,aes(x = Sepal.Width, y = Sepal.Length, fill = Species)) +geom_hdr() + scale_fill_aaas() +facet_wrap(vars(Species))
版本二
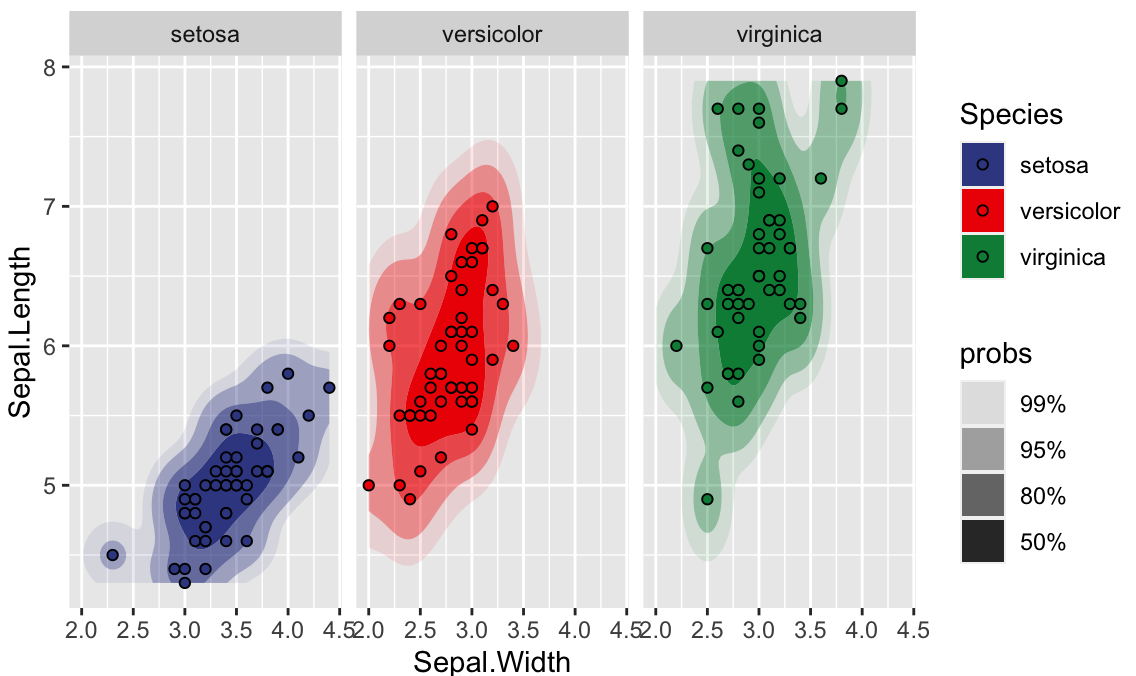
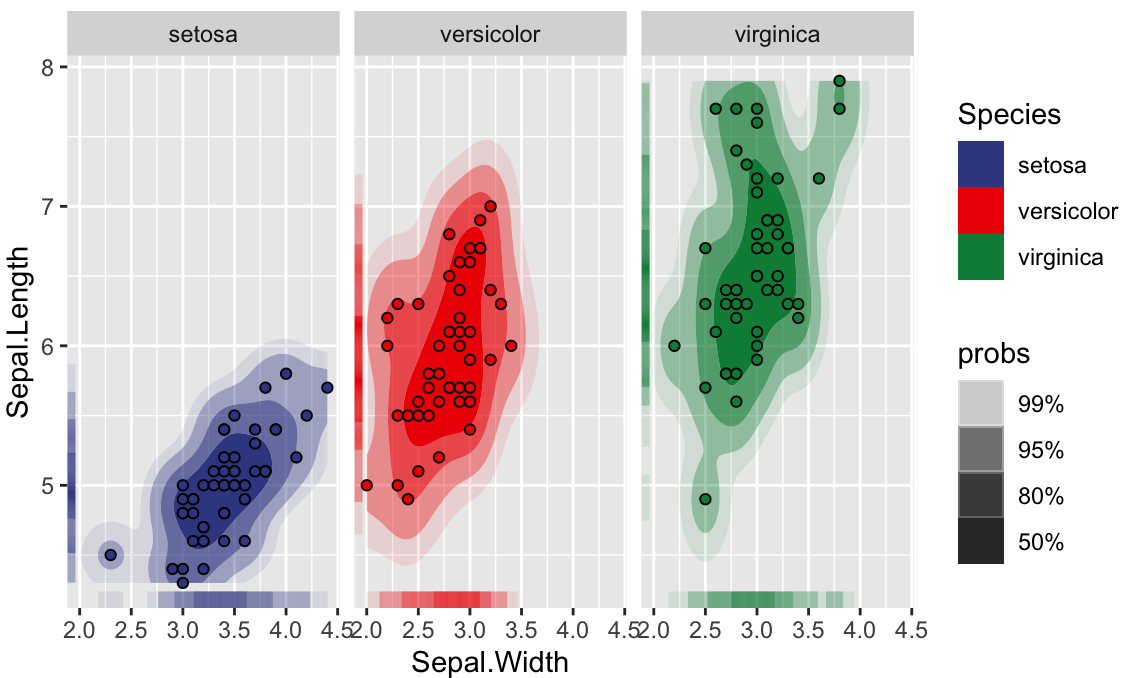
为了说明各个点的位置,可以直接在原来基础上增加代码:geom_point(shape = 21)。
# 增加点
ggplot(iris,aes(x = Sepal.Width, y = Sepal.Length, fill = Species)) +geom_hdr() + geom_point(shape = 21) +scale_fill_aaas() +facet_wrap(vars(Species))
版本三
使用 geom_hdr_lines() 配合 geom_point(),得到等高线(没有填充)和对应点。当然如果你觉得点的颜色太花了,可以在geom_point() 设置 color = "black"。
ggplot(iris,aes(x = Sepal.Width, y = Sepal.Length, color = Species)) +geom_hdr_lines() +geom_point() +scale_color_aaas() +facet_wrap(vars(Species))

版本四
在原来的基础上,使用 geom_hdr_rug() 加入地毯。
ggplot(iris,aes(x = Sepal.Width, y = Sepal.Length, fill = Species)) +ggdensity::geom_hdr() + geom_point(shape = 21) +scale_fill_aaas() +facet_wrap(vars(Species)) +geom_hdr_rug()
版本五
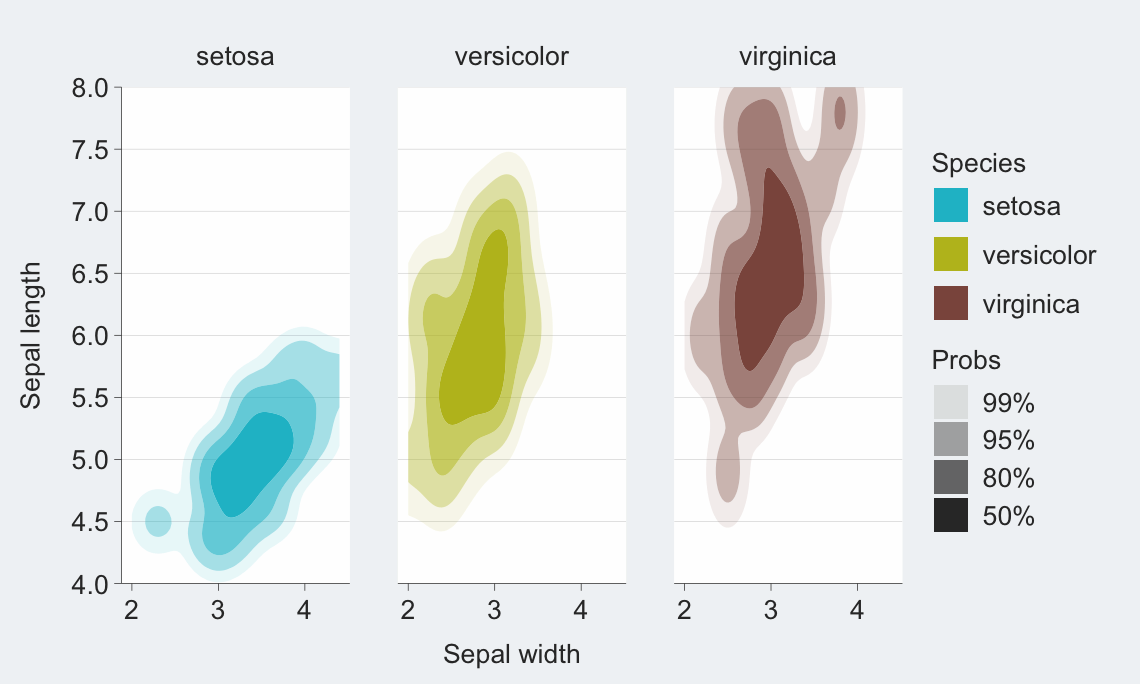
这里还可以使用 {ggblanket} 包绘制,该包集成了 ggplot 的语法,对新手使用更加方便。例如,iris 包绘制等高线可由以下代码实现。
iris |>gg_blank(x = Sepal.Width,y = Sepal.Length,col = Species,facet = Species,col_legend_place = "r") +ggdensity::geom_hdr(colour = NA) +labs(alpha = "Probs") +theme(legend.title = element_text(margin = margin(t = 5)))
小编有话说
- 关于文章所提的文献中的图,本文并没有做复现工作,使用
geom_hdr(),factet_wrap(),geom_text()和annotate()基本就可以满足需求。
相关内容
热门资讯
考试反思【精选5篇】
考试反思 篇一近期的一次考试结束后,我开始反思自己的考试经历,并思考如何提高自己的考试成绩。通过深入...
08年常州市中考优秀作文《告...
08年常州市中考优秀作文《告别英雄》 篇一告别英雄我国有许多英雄,他们为国家和人民做出了巨大的贡献。...
开在心中的花朵中考作文
开在心中的花朵中考作文 无论在学习、工作或是生活中,许多人都有过写作文的经历,对作文都不陌生吧,借...
上海热带风暴水上乐园一日狂欢...
上海热带风暴水上乐园一日狂欢-初二-说明文 篇一上海热带风暴水上乐园是一家位于上海的大型水上乐园,是...
28人2.5亿元存银行不翼而飞...
每经编辑|程鹏 据极目新闻报道,7月15日上午,“2.5亿存款不翼而飞”涉案储户起诉三家银行案在广...